Choosing to become a freelancer is both a positive and risky decision. You are setting our on your own, giving up the safety net of a steady employer. You are taking a step to be dependent entirely on yourself and no one else. It is liberating and terrifying, all at once.
Whether you are currently a freelancer in any industry or you are just thinking of taking the leap, these infographics can help. They are full of useful information and statistics.
1. The Pitfalls of Freelancing

Although freelancing is an excellent means of getting far in your chosen career while maintaining your freedom, it isn’t all rainbows and gumdrops. In fact, it can be downright difficult. There are some pitfalls that are hard to avoid, such as cheating clients not paying for a project or getting enough work consistently through the year. Sadly, there is no way to avoid these issues 100 percent. But this infographic goes over these struggles and provides the perks to counter them. You should feel much better after reading it. It also gives some interesting statistics, such as how many freelancers are working independently now, how many are men versus women, and other facts you might not have known.
2. Graphic Designer’s Journey: Freelance to Freedom

Are you a graphic designer? Then you are sure to love this one. It shows the common stages of your career as a freelancer, starting at working for a quarter of what your studio earns for your work and being treated like crap by your boss to eventually becoming a web entrepreneur who earns enough to support themselves. It is funny and also pretty accurate, other than some mild exaggerations – hopefully! – like your spouse leaving you for someone who showers regularly. Of course, that might be your life as well – who knows?
3. Should I Work for Free

This is a simple flowchart to help you figure out the answer to the question: Should I work for free? While the usual answer to this will be a resounding, “No!” that isn’t always the case. This infographic will help you determine whether it is proper for you to provide your services without any kind of compensation. Of course, this is only a guide; the ultimate decision is up to you.
4. The Freelancer’s Tax Guide

The most stressful part of freelancing for many is figuring out how to deal with taxes. As an American freelancer, you might feel pretty overwhelmed. You should probably go to an accountant to help you figure it all out (and there are many freelancing accountants, as well). But having a basic understanding doesn’t hurt. This infographic tries to help you through it all.
5. Freelance at a Glance

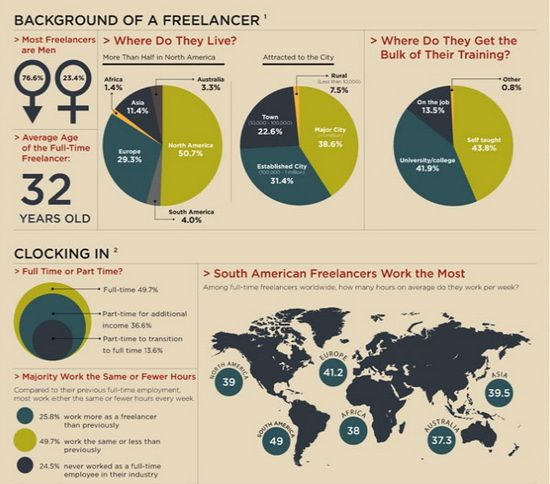
Want to know a whole bunch of interesting but probably not very useful facts about freelancers? This infographic has a ton of data, such as the percentage of male versus female freelancers, the average age and where they get the majority of their training. However, keep in mind this one is more genre specific than the infographic with the same data above, which is why some of the info might seem less consistent. For example, this one says there are more male than female freelancers, whereas the one above claims more female than male.
6. Why Become a Freelancer?

Why do people become freelancers? There are many reasons: being able to be their own boss, the ability to work from home, making more money, being self-sufficient – there are many advantages that lead to making that decision. This chart is based off of a survey that tracks commonalities like happiness level, preference and work hours.
Conclusion
If you are on the fence about becoming a freelancer, these infographics will probably push you over into the “Yes!” camp. There is a reason so many people have turned to self-employment. Whether you are officially trained or self-taught, there are so many opportunities that it is the perfect time to get involved.
Tom Chu is the SEO manager at PsPrint, a company specializing in online printing. PsPrint offers an array of free tools, for example it lets you make your own business cards online. Follow PsPrint onTwitter and Facebook

Leave a Reply